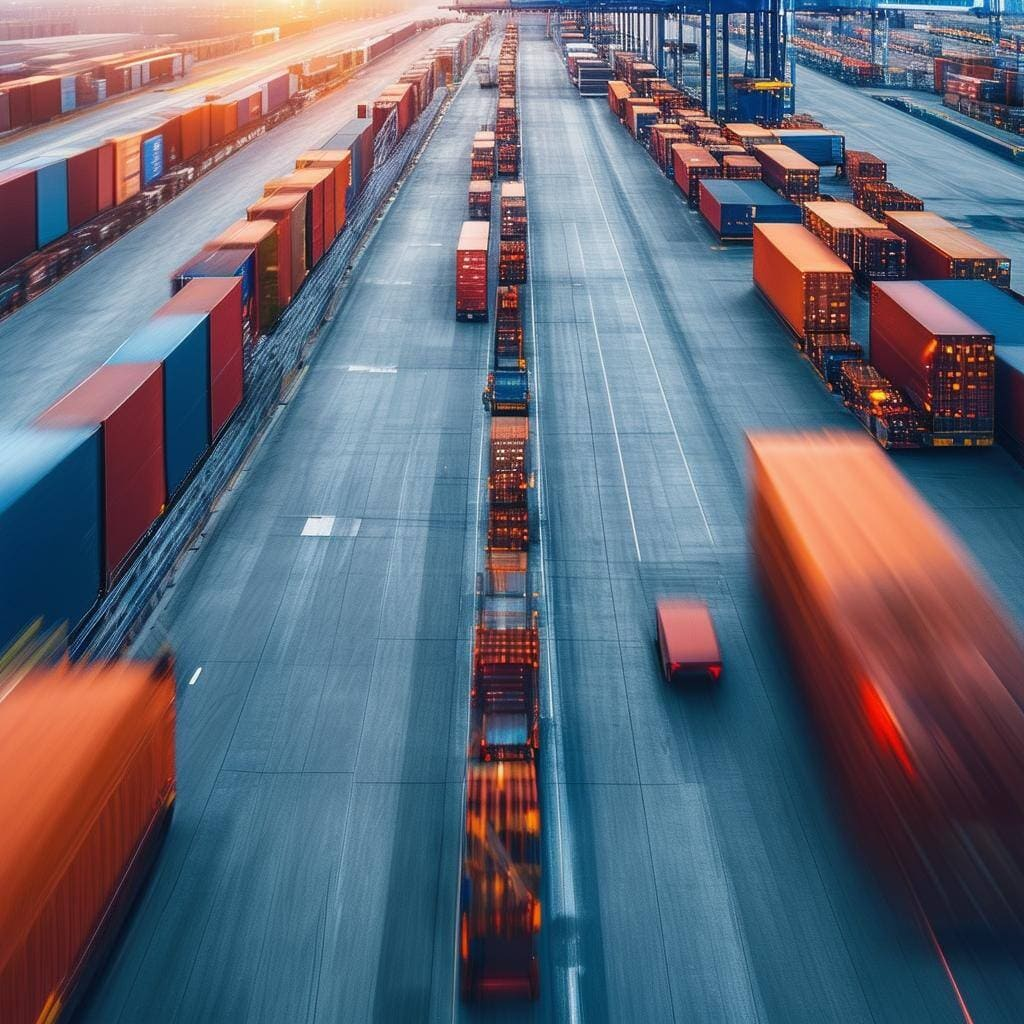
Smarter Transport Is Greener - and Cheaper
In logistics, speed and efficiency often take center stage - but smarter transport planning can also make your business significantly more sustainable. By optimizing routes and maximizing trailer utilization, you can cut carbon emissions while saving real money.
💡 Better Utilization = Lower Emissions
A half-empty truck doesn't just waste space - it wastes fuel and adds unnecessary CO₂. For example, a fully loaded truck traveling 1,000 km emits around 1.14 tonnes of CO₂. Multiply that across your fleet, and the impact adds up fast.

🚛 Remove One Truck, Save 228 Tonnes CO₂
If a single truck makes 200 trips a year, optimizing your network enough to remove it entirely could eliminate 228 tonnes of CO₂ annually. That's equivalent to:
- Planting over 10,000 trees
- 285 roundtrip flights from NYC to Chicago
- A year's energy use for 18 homes

📉 Financial Benefits
With annual truck operating costs between $120K–$200K, and carbon offset values reaching $100/tonne, reducing just one truck can bring six-figure savings - before you even count fuel and maintenance.
✅ Efficiency Wins
Smarter scheduling, real-time insights, and AI-powered logistics tools don't just optimize your supply chain - they build a leaner, cleaner operation. The most sustainable transport solution is often the most efficient one too.